No Extra Tools
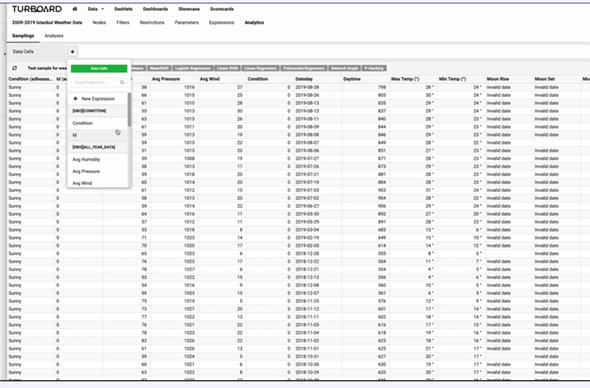
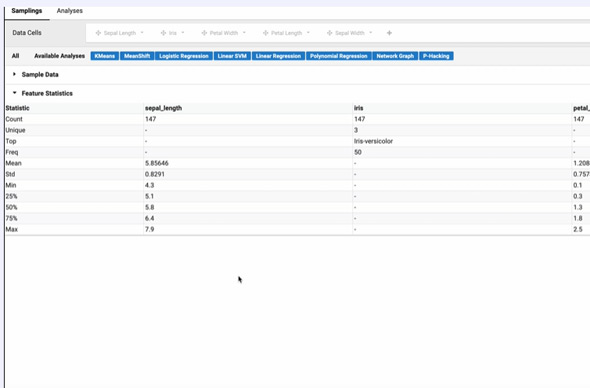
With TURBOARD’s built-in Python-powered technology, there is no need to transfer output data to carry out data science operations using other tools.
You don't need to know anything about Python. All you need to know is how to use a mouse.


Connect Model to Live Data
When you apply a model using TURBOARD, it is applied to the whole data set, not just to the sampling. TURBOARD’s BI filters are run hand-in-hand with analytics powered expressions. For example, you can compare the regression line in one region with whole-country data or you can monitor to see in which areas of your business your predictions have been more accurate.

A General How-to-Use Guide
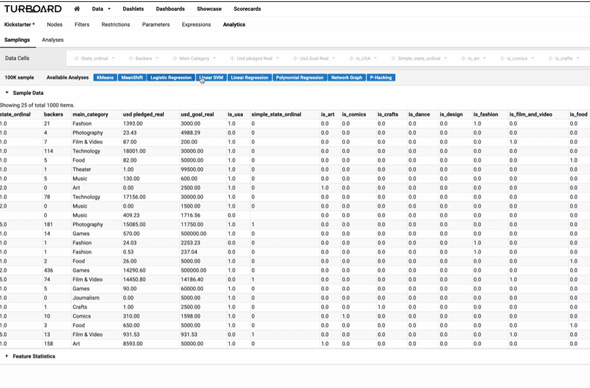
- Select a sampling.
- Leave data science parameters on their default setting. You may play with them later on.
- Select a numeric target variable and source variables.
- A formula will be produced that will predict the target in most cases using variables.
- Check the quality of analysis using the specific tools provided.
- Auto-create a TURBOARD dashboard.


Machine Learning with Regression
Explanation
To predict a target value from several (preferably independent) variables, regression algorithms attempt to find a formula that best matches the sampling.
For example, imagine you have the data on all taxi rides in a city (kilometers driven, trip minutes, and fee for each ride). Regression analysis will produce the best formula to fit the majority of the taxi rides. R-squared (r2) is a quality metric for regression, describing the percentage of sampling that is perfectly defined by the formula. If r2 is 0.9, that means the formula accurately defines 90% of all taxi rides. There will be reasons why the other 10% of rides are not covered by the formula. For example, some users may bargain for lower fares, and sometimes taxi drivers will keep the change.
Which Algorithms Can Be Used?
In TURBOARD, you can use linear and polynomial regression models.
Possible Uses
- What will be the turnover if we change the price of a product along with changing the price of its substitute/competitor products?
- Calculate output of machines given all engineering parameters up to now. Identify outperforming and lagging machines.
- Based on your data of hundreds of projects and their different parameters, you may determine another parameter for future projects. For example, you may be able to predict the total expenditure for the project based on the number of people (with their assignments) and geographical and time factors. You can even use ordinal data such as severity of project and rigidity of terms.
What to Check for Best Results?
- Check the R-squared (r2) value in "Generated Expression" after selecting each source parameter to ensure you have the most relevant parameters for predicting the target variable. The higher the value of r2, the better your prediction will be.
What Will Be The Default Output Dashlet?
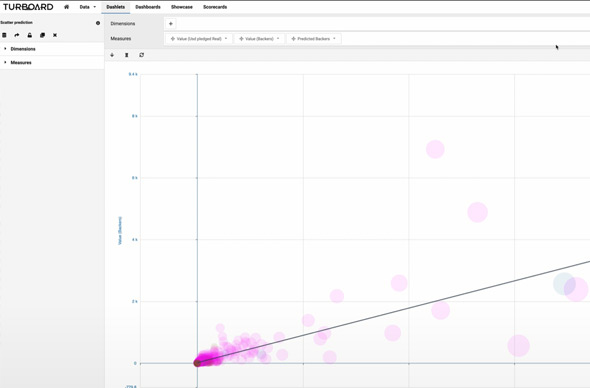
- It will produce scatter charts.
- You may want to use conditional formatting to deduce more on those scatter charts.
A Sample End Results (From Open Data)
Forecasting with Classification
Explanation
Given a target variable, a classification algorithm will learn how data would decide that specific target variable and in new parameters will predict an output.
Which Algorithms Can Be Used?
SSVM and Logistic Regression are available algorithms that can be used without any single line of coding.
Possible Uses
- Churn analysis: use your customer data, tag customers as lost and active. TURBOARD will produce the model result to predict whether or not a customer would be lost with current data, so you can take action before it's too late.
- Machine fail prediction: use the data of your previously failed machines and predict which machine is more prone to a fail in near future.
What To Check For Best Results?
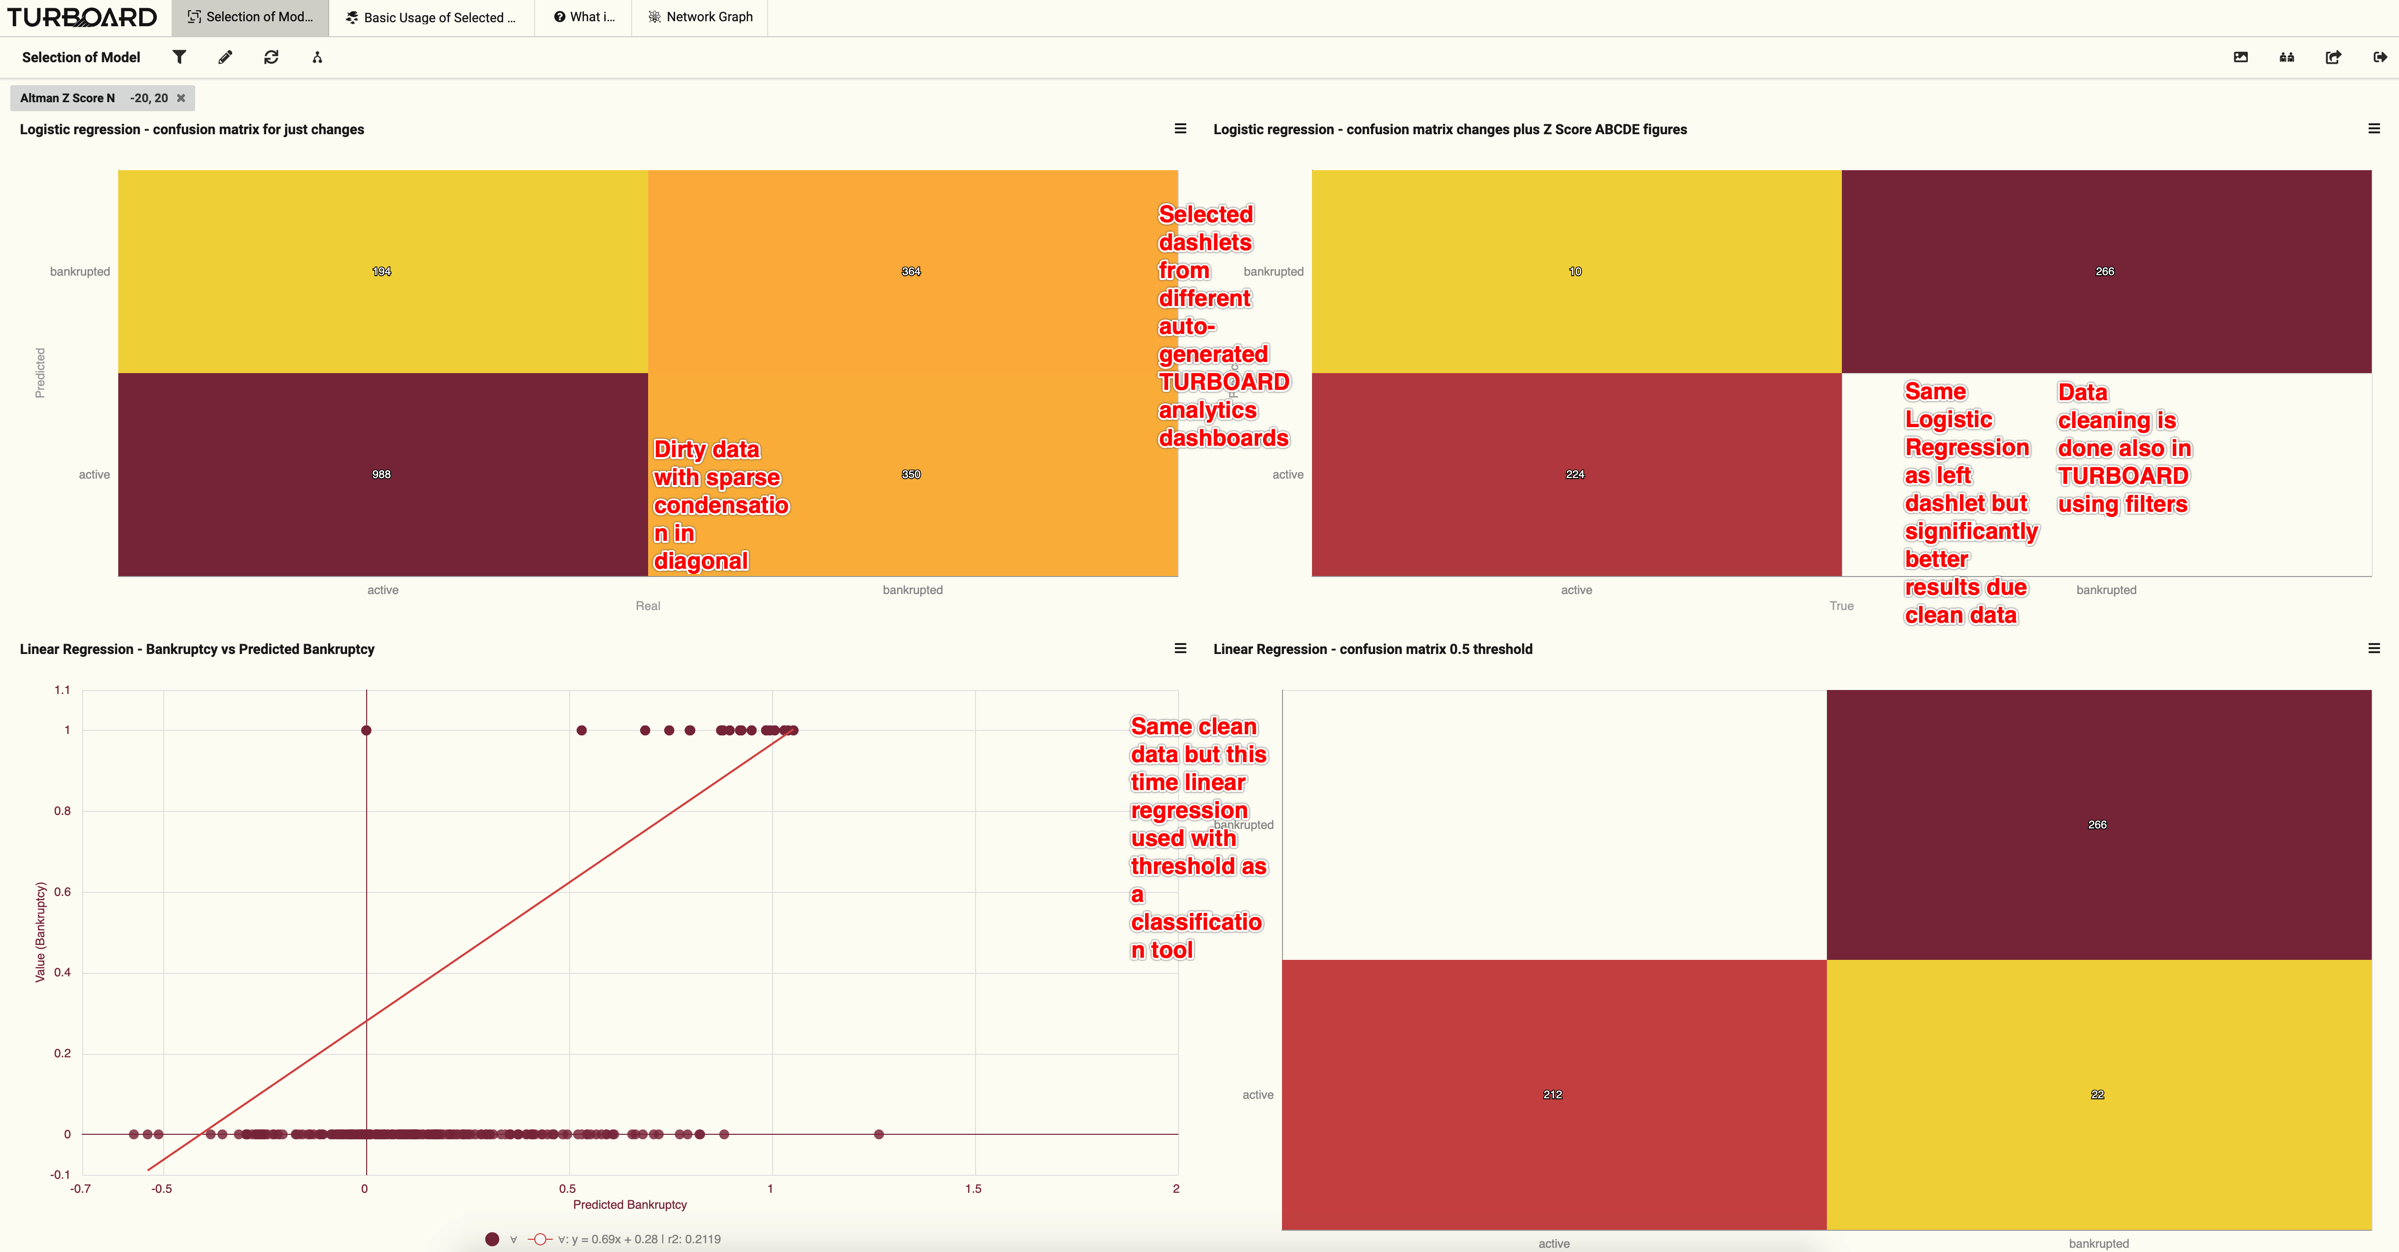
- Check the confusion matrix (a table showing prediction vs. real) that
will be provided in the playground and will be one of the default
visualizations that will be created. Condensation on diagonal tells it's
doing the job.

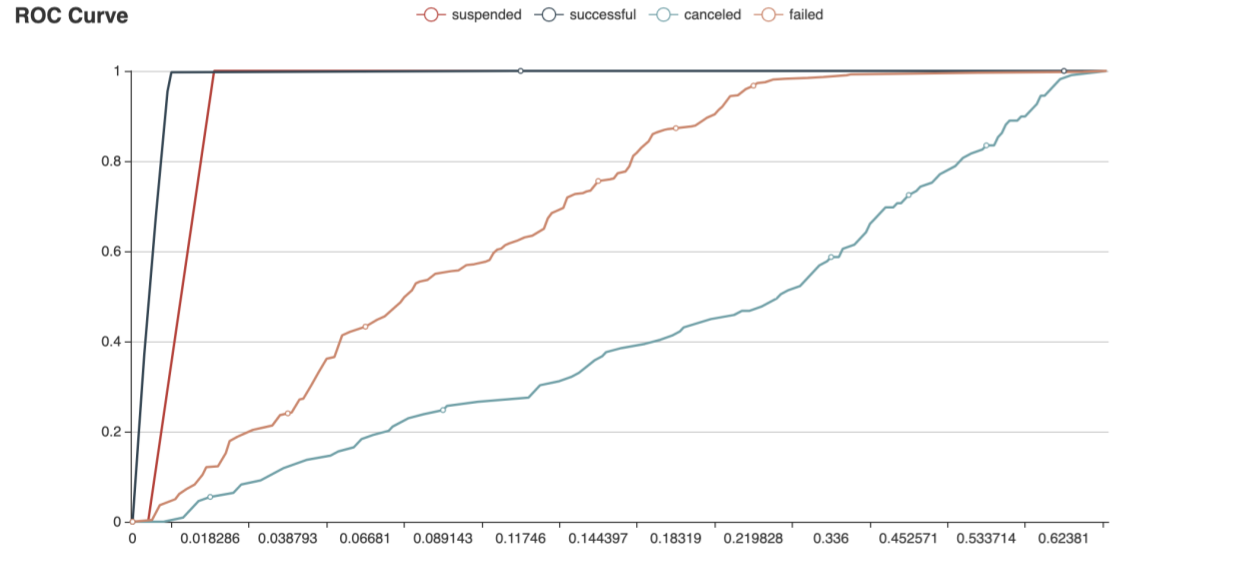
- Check ROC Curve to see the performance of the classification model compared
by different classification intervals.
What Will Be The Default Output Dashlet?
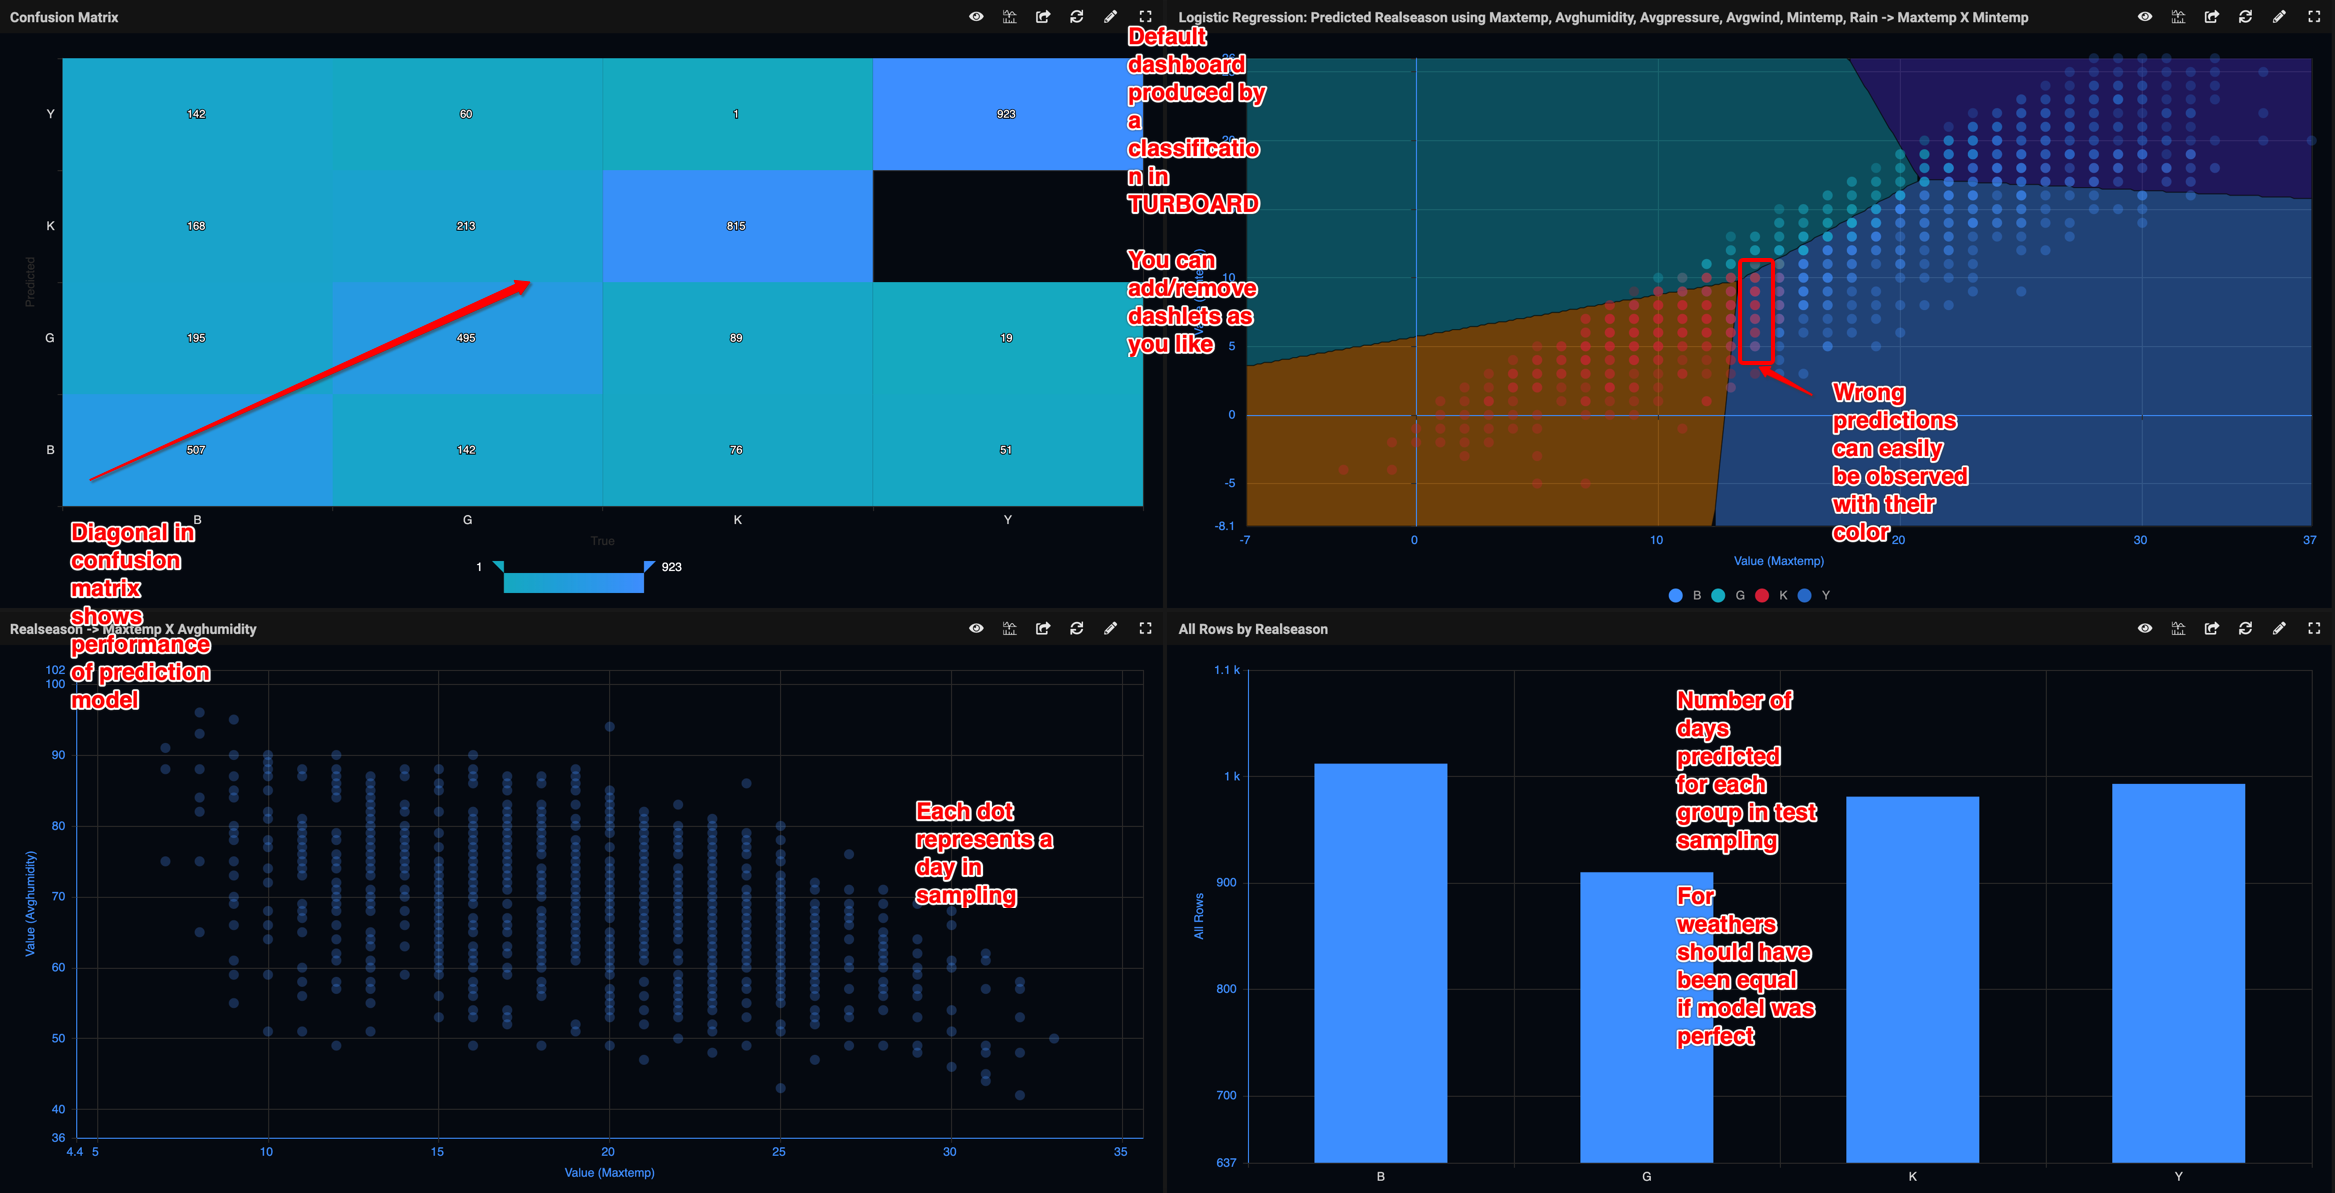
- Confusion matrices that can be used as slicers so that you can just click on the matrix and filter results.
- Visual check of colors and groupings in polygonal regional colored scatter charts. See "Weather Prediction" image below.
- Column charts showing groups of results by different categories and measures used.
Sample End Results (From Open Data)


Data Mining with Clustering
Explanation
Given any number of parameters, clustering will create groups of entities depending on their proximity.
Which Algorithms Can Be Used?
TURBOARD has K-means and Mean Shift in its pre-built statistical models repository.
Possible Uses
- Group your customers and prepare relevantly targeted campaigns.
- Physicians who performed cesarean sections, grouped according to their disposition, their geographical location and hospital type. Filter by days of the week and see the changes in real live data.
What To Check For Best Results?
- Just check the groups in resulting charts with respect to their placing.
- Use groups as filters and check in a normal TURBOARD dashboard whether or not this grouping made sense.
What Will Be The Default Output Dashlet?
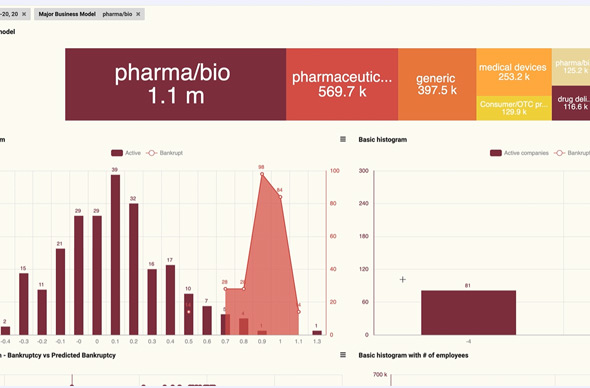
- TURBOARD will create grouped polygonal scatter charts for pairs of parameters. Since it is not possible to represent hyperspace in a way that humans can understand, these cross-sections are the only way to show the results of the model.
Sample End Results
Finding The Hidden Patterns
Explanation
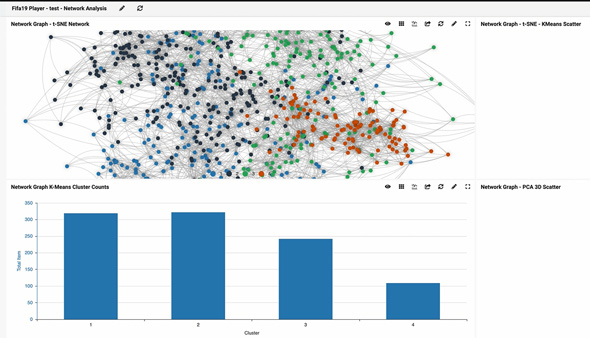
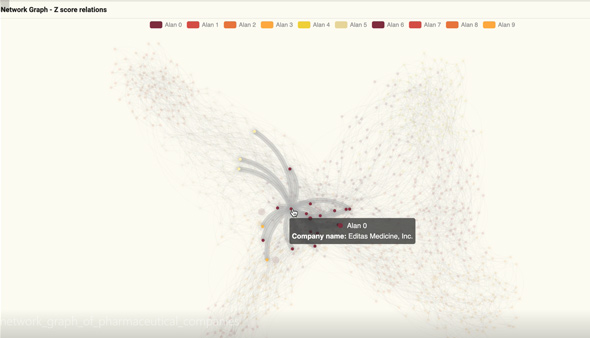
- Network graph: not just dashlet type, but an analytics tool.
- P-hacker: slice and dice data to find the best correlation between selected variables (using that tool).
Which Algorithms Can Be Used?
- Network graph uses t-SNE or PCA.
- P-hacking is a hybrid tool.
Possible Uses
- You can find which of the items sold in which branches are most sensitive to price changes.
What To Check For Best Results?
- On a network graph, the t-SNE algorithm will neatly show resembling data close to each other.
- You can use TURBOARD to add further groups and detect anomalies.
What Will Be The Default Output Dashlet?
- Network graph.
- 2D representation on scatter.
- 3D chart.
Sample End Results


Artificial Intelligence-Powered What-If
Explanation
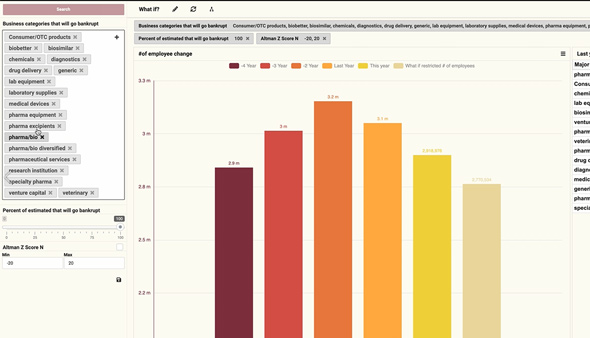
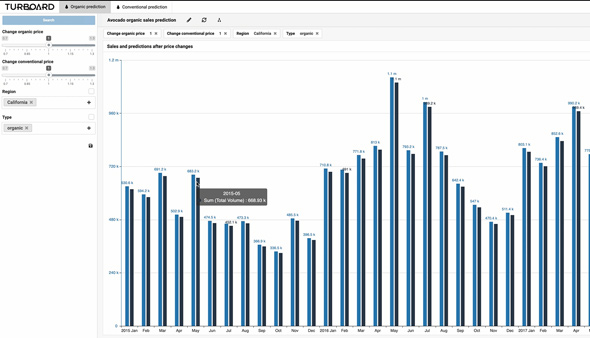
TURBOARD What-If reports are unique in that they can use statistical models within the what-if analysis. For example, it may be possible to predict that a 20% increase in price will not boost turnover by 20%, as the AI may predict there will be less sales at the increased price.
Which Algorithms Can Be Used?
- Linear or polynomial regression can be used.
- You can use parameters hand in hand with analytics powered expressions.
Possible Uses
- Take into consideration substitutes, complimentary products, and competitor market prices and predict sales volume by simulated price changes. Maximize your profit with best pricing. Check out the video in the "Solution Package for Grocery Store Chains" page under "Pricing" tab.
- Set your annual budget by playing with functional, economical, and administrative budget categories. Target a next year's total budget. Determine the effects of compromises before, not after, the budget has been set.
What To Check For Best Results?
- Use the patent-protected cloning functionality of TURBOARD to see both the What-if changes and the real data next in adjacent columns.
What Will Be The Default Output Dashlet?
- What-if can be applied to any dashlet and there is no auto-generated dashlets for that analytics type.
Sample End Results

To reveal striking insights hidden in your own data, discover 
